

Your Blue Wave Tracker


A political analyst I respect commented before the 2024 election that he didn’t know which candidate would win the presidency, but he was certain that the winner’s party would take a beating in the 2026 midterms.
That prediction was fairly easy to make. The electorate has treated incumbent parties quite poorly in midterms, and 2026 is poised to continue the pattern.
But doing poorly in an election and being flattened by a wave are different things.
Waves happen when the electorate repudiates a party. In wave years, the opposition party performs at or even beyond the high end of what is believed possible, winning states and districts that would not be competitive in a normal year. Waves can generate stunning and unexpected upsets. They can see most close races fall in unison to the opposition. They can leave the incumbent party with little more than debris to gather from their former majority position.
I’ve been writing about the possibility that 2026 will be a wave year since the first weeks of the Trump administration, when it was clear that Trump was determined to take a series of unpopular actions at odds with his campaign promises—and Republicans were unwilling to challenge him.
In those posts, I focused on several factors that could be viewed as early indicators of wave potential: high levels of voter anger; consistent Democratic over-performance in special elections; the ability of Democrats and the failure of Republicans to recruit top-tier candidates; and more Republicans than Democrats running for the congressional exits.
Now that the election is less than eight months away, we can expand our focus and examine a broader set of metrics that should give us a clearer picture of just how ugly the 2026 electoral environment is for Republicans.
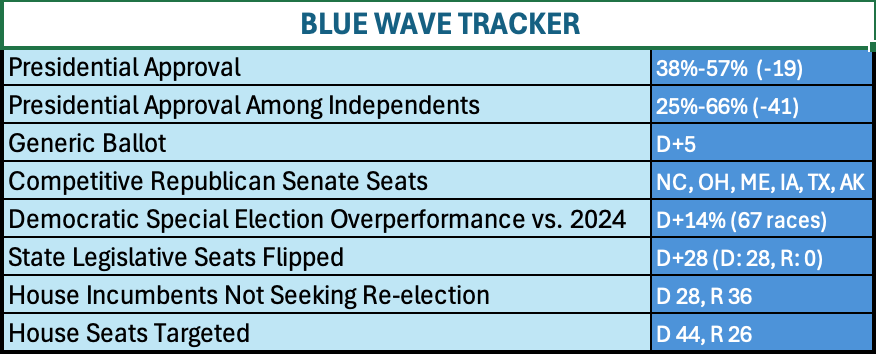
To this end, I’m introducing a Blue Wave Tracker that contains eight measures which tell us something about the condition of the electorate. As we go through the year, some of these measures—like presidential approval and the generic congressional ballot—should begin to take on a predictive quality. But the purpose of the tracker is to assess how strongly the political climate is conducive to a wave at this moment—not to make predictions. Do the metrics all point in the same direction? Do they suggest the electorate is poised to roundly reject Republicans? These are the questions I’m hoping to answer.
Let’s take a look at the tracker and briefly consider what each metric is telling us about the potential for wave development.
Presidential approval
This is a big one. Donald Trump will not be on the ballot this year, but the midterm electorate is poised to render a verdict on his leadership, so the fates of the president and his congressional partisans are linked. The more unpopular the incumbent, the worse we should expect things to be for his party.
And Donald Trump is very unpopular.
With an average net -19 approval score as measured by the site Fifty Plus One, Trump has placed his party in danger of being washed away. At present, 57% of the country is unhappy with his job performance, while fewer than four in ten approve. This is wave territory if it does not improve, and neither the trend lines nor Trump’s refusal to course correct suggest it will.
Presidential approval among independents
Compounding the problem for Republicans is their loss of support among independent voters—the swing voters who can determine close elections. An Economist/You Gov poll conducted late last month and reported above shows Trump has lost the support of independents, who give him a net job approval of -41, with two-thirds disapproving. (A recent CNN poll showed a similar result). One characteristic of wave electorates is independents breaking heavily for the party out of power. Couple this with strong turnout from out-party supporters and diminished interest from supporters of the president’s party—a potential outcome supported by some of the other measures we’ll discuss—and you have a recipe for a lopsided result.
Generic ballot
The generic ballot is an aggregate measure of which party people would select with their congressional vote. The generic ballot doesn’t replicate the actual choice voters will make because it doesn’t include the names of actual candidates, but it can serve as a rough approximation of how people are likely to vote. As Election Day gets closer it can also be a fairly reliable indicator of the final aggregate two-party House vote.
According to Fifty Plus One, Democrats lead Republicans by five points in the generic ballot across recent polling. This may not look like an especially large number, but it points to a favorable environment for Democrats. And the Democratic advantage has been steadily growing since last year. Last March, Democrats and Republicans were tied. When Trump was inaugurated, Republicans enjoyed a three-point advantage. So the generic ballot has moved eight points toward Democrats in slightly over a year.
Competitive Republican Senate seats
We don’t have an equivalent measure to the generic ballot to evaluate Senate outcomes, but we can look at individual contests to see if there is a path for Democrats to regain the majority. As of this month there is. With a three-seat majority and control of the White House, Republicans would lose the Senate if Democrats can net four seats.
This is a tall order when you look at the Senate map. Because only one-third of the Senate is in play every year, the fate of the parties depends in part on which seats are in cycle. While Republicans are defending more seats than Democrats this year, they are almost exclusively in red or purple states. So the metric we’re examining is whether there are at least four competitive Republican seats (assuming in a wave election that Democrats would be able to hold their vulnerable seats).
Right now, Senate polling is slim, but what little exists shows Democrats ahead or competitive in six Republican-held seats: North Carolina, Ohio, Maine, Iowa, Texas and Alaska. These are all challenging contests for Democrats, and (with the possible exception of Maine) they wouldn’t have been in reach two years ago. The fact that Democrats are in the game is consistent with the advantage they hold in the House.
Democratic special election over-performance vs. 2024
This is one that Chris and I have been discussing since Trump was inaugurated. Democrats have been winning special elections by outsized margins since the start of last year. According to The Downballot, across 67 races Democrats have performed an average of 14 points ahead of their 2024 results. Although special elections are not indicative of general election results, they also do not happen in isolation. Special election results may not predict the margin of a party’s over-performance, but they are a good gauge of the direction things are moving in the general election, and things have been moving strongly and consistently toward Democrats for the past 15 months.
State legislative seats flipped
Like special election results, the ability to flip seats in the run-up to the midterms is a good measure of how the political climate is moving. For instance, just last week Democrats captured a New Hampshire state legislative seat that Trump had won in 2020 and 2024. According to Politico, such red-to-blue flips happened 28 times since the start of the second Trump presidency, while Republicans have yet to flip a Democratic state legislative seat.
House incumbents not seeking re-election
When things look bad, incumbents are more likely to look for new career opportunities. This is especially true in the House, where serving in the minority means being powerless to set the legislative agenda. So it shouldn’t be surprising that The Downballot reports 36 incumbent Republicans are not running for re-election, compared to 28 Democrats. When incumbents step down, they give up the advantages of their office and make the resulting open seats more competitive for the opposition party. This in turn gives the challenging party more opportunities to build on favorable dynamics and amplify the size of a wave.
House seats targeted
Not surprisingly, Democrats are targeting more Republican seats than Republicans are targeting Democratic seats. Each party has committees dedicated to taking (or holding) the House majority (similar committees also exist in the Senate). Thus far in 2026, the Democratic Congressional Campaign Committee (DCCC) is going on offense in 44 Republican districts, where they will put resources behind the Democratic candidates. In contrast, the National Republican Congressional Committee (NRCC) is only targeting 26 Democratic seats—an admission that they see fewer opportunities in a difficult political climate.
What it means
As of mid-March, conditions are building for a wave election of some magnitude. Democrats are well positioned to claim the House majority and they are competitive in enough states to make a play for the Senate. Donald Trump’s unpopularity (in general and with independents) is pulling down the Republican brand, and Trump is only doing things that will make it worse.
Democrats have a sustained and growing lead in the generic ballot. They have been performing well beyond expectations in special elections and flipping Republican state legislative seats at a steady pace without losing any ground of their own. Republicans are retiring from Congress at a faster pace than Democrats, and Democrats see far more opportunities to take Republican seats than Republicans see to flip Democratic seats.
These metrics are all pointing in the same direction. We will revisit them periodically as the midterms get closer.
Again, you are the calm voice in my head. Thank you for this succinct recap of where we stand against Trump and the "do nothing" Republicans.
Thank you for putting this together! I've been thinking about all these variables and was having a hard time remembering them, but this is so useful and easy to understand.